Riding the Wave: A Dual Peak Emerges in Semiconductors (SMH)
Double Top, as a technical trading pattern, is of great significance in the world of investing. It is particularly invaluable when one is dealing with the Semiconductor ETF, symbol SMH. Whether you are a seasoned trader or an investment enthusiast, the double top pattern illuminates the chart with insights that you would otherwise overlook. This article will thoroughly explore the double top on Semiconductors to equip you with the knowledge that underpins savvy trading in the semiconductor ETF, SMH.
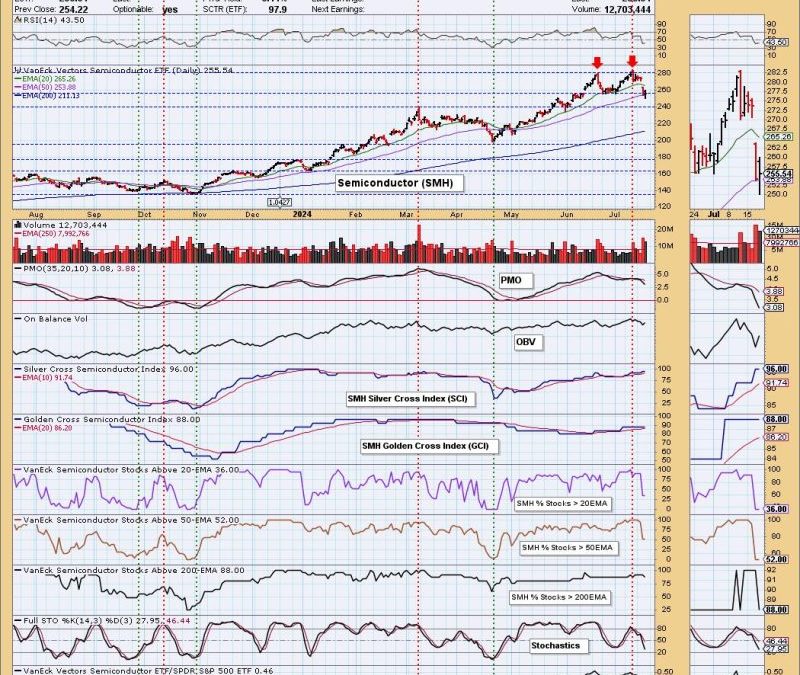
The double top is a bearish reversal pattern that emerges after an upward move in the market. This pattern resembles an ‘M’ shape and is characterized by two consecutive highs, created when an asset fails to push through a particular price level twice. The significance of this pattern in Semiconductors is that it signals a potential trend inversion, from bullish to bearish.
Unpacking Double Top Pattern on Semiconductors (SMH)
To identify a double top pattern on the SMH chart, savvy investors watch out for two occurring rallies, where the price reaches about the same level in both cases, separated by moderate price declines between them. After the second rally, if the price drops and breaks below the support level (the lowest point between the two tops), it would be an indication that a bearish trend reversal is likely to happen.
The reason why investors pay careful attention to double top patterns on semiconductors is due to the unpredictability and highly competitive nature of the semiconductor industry. Factors such as industry cyclicality, technology disruptions, manufacturing issues, and international trade can cause significant price shifts in semiconductor stocks. Hence, a double top could presage potential losses, signaling traders to typically sell their positions or adopt protective strategies.
It’s important to note that the double top pattern doesn’t guarantee a full bearish reversal. It’s possible that the price could fail to break the support level after the second peak or even make a false break, then continue with its uptrend. Aware of these risks, seasoned traders often look for additional confirmation signals such as volume or momentum indicators before executing their trades based on a double top pattern.
Benefiting from Double Top Pattern on Semiconductors
To effectively use the double top pattern on semiconductors, it’s crucial to wait for the pattern to be completed by breaking and closing below the support level. A premature move may lead to engaging in an anticipation trade, which carries high risk as the pattern may not always complete.
Another tactic involves calculating the potential price target